|
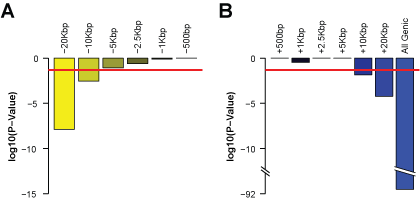
We defined the optimum promoter as the maximum region around the Transcriptional Start Site (TSS) that produces similar sensitivity and specificity of TF-target gene predictions as the core promoter (i.e., ±500bp of the TSS). To find this optimum size, we fixed the downstream (3') promoter boundary at +500bp and varied the upstream (5') promoter boundary (-1, -2.5, -5, -10 and -20Kbp; Figure 1A). Relative to the core promoter, a significant decrease in the sensitivity and specificity (p-value = 0.05) was observed when the upstream promoter boundary increased beyond -5Kbp (p-value = 2.9 x 10⁻³; Figure 1A; Supplementary Table {DefiningPromoter}). We then set the upstream promoter boundary at -5Kbp and varied the downstream promoter boundary (+1, +2.5, +5, +10, +20Kbp, and all genic sequences; Figure 1B). We observed a significant decrease in sensitivity and specificity when the downstream promoter went beyond +5Kbp (p-value = 1.5 x 10⁻²; Figure 1B; Supplementary Table {DefiningPromoter}). Thus, we empirically defined the optimal promoter search space for potential TF binding sites to be ±5Kbp from the TSS of human genes, and this was the promoter size used to pre-compute the mechanistic TF regulatory network (i.e., a rigorously tested database of TF-target gene interactions). Using glioblastoma multiforme (GBM) as an example, we demonstrated how this database can be used to infer a comprehensive causal TF regulatory network for any complex disease.
Figure 1. Results of varying promoter region on ROC AUC using ChIP-seq as gold standard. A. Comparisons of ROC AUCs from increasing upstream promoter lengths were made relative to the core promoter size of ±500bp. A promoter length exceeding the red line indicates a significant reduction in ROC AUC (p-value < 0.05). B. Comparisons of ROC AUCs from increasing downstream promoter lengths were made relative to the promoter size of -5Kbp and +500bp. A promoter length exceeding the red line indicates a significant reduction in ROC AUC (p-value < 0.05). |
 |
|


