|
This database of transcription factor (TF) to target gene interactions was constructed by combining: 1) human genome sequence, 2) 2,331 unique DNA recognition motifs for 690 TFs from human and mouse genomes (Matys et al., 2006; Newburger and Bulyk, 2009; Jolma et al., 2013; Mathelier et al., 2014), and 3) occupancy of 8.4 million genomic sites through ENCODE DNase I footprints across 41 diverse cell and tissue types (Neph et al., 2012). In total 17,415,125 significant motif instances (FIMO p-value = 1 x 10⁻⁵) were discovered for the 2,331 TF DNA recognition motifs using an optimal promoter size of ±5Kbp from the transcriptional start site. A quarter of these motif instances (3,505,491 motif instances) that overlapped by at least 1bp with a digital genomic footprint (DGF) were used to construct a mechanistic regulatory network of 690 TFs regulating 18,153 genes.
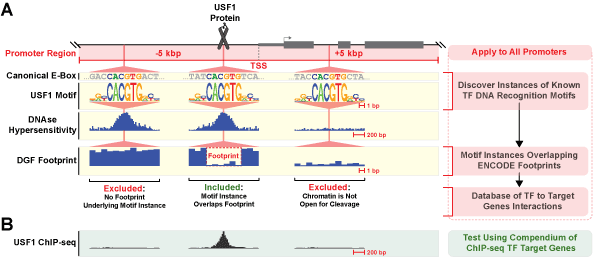
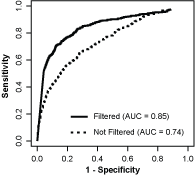
| Figure 1. Construction of genome-wide TF to target gene database using by integrating genomic sequence, TF DNA recognition motifs, and DGF footprints. A. Promoter regions of genes (±5Kbp of the transcriptional start site (TSS)) were searched for DNA sequences that significantly matched a TF DNA recognition motif. As an example we use the TF USF1 which has three DNA sequences (motif instances) that significantly match the USF1 DNA recognition motif. The USF1 protein binds to only one of these motif instances, but from sequence alone it is not possible to discriminate between functional and non-functional motif instances. The DNAse I hypersensitivity hotspots from DNAse I-seq provides information about which regions of a promoter have open chromatin. However, presence of a DNAse hypersensitivity hotspot does not directly imply a motif instance will be bound by its cognate TF. Digtial Genomic Footprinting (DGF) provides a means to empirically determine the genome-wide occupancy of DNA by TFs and other factors at nucleotide resolution. Using the additional evidence provided by DGF footprints that something was bound to the same location as a motif instance allows us to exclude a large fraction of motif instances that aren't bound by a TF. B. ChIP-seq with antibodies specific to a particular TF provides a means to empirically determine the genome-wide binding locations for a specific TF. We compare our predicted TF to target gene interactions to specific binding patterns provided by ChIP-seq studies. C. Filtering predicted transcription factor binding sites through DNAse I hypersensitivity footprints significantly increases sensitivity and specificity for predicting TF from ENCODE ChIP-seq studies. Each line is a ROC curve for comparison to the corresponding the ENCODE ChIP-seq studies. AUC = area under the curve. |
 |
We systematically evaluated the sensitivity and specificity of this inferred mechanistic regulatory network by comparing the predicted TF-target gene interactions against a physical map of protein-DNA interactions constructed from 148 ChIP-seq experiments across 72 cell lines and covering 78 different TFs (Figure 1B) (Wang et al., 2012). This comparative analysis demonstrated that the sensitivity and specificity of TF-target gene predictions for the DGF-filtered motif instances were significantly better relative to predictions based on all instances (unfiltered receiver operating characteristic area under the curve (ROC AUC) = 0.74; filtered ROC AUC = 0.85; p-value = 6.9 x 10⁻⁸; Figure 2). Remarkably, the mechanistic regulatory network also accurately predicted TF-target gene interactions in cell lines and tissues that were not represented within the ENCODE compendium of DGF profiles (DGF profiled ROC AUC = 0.85, not profiled ROC AUC = 0.82, comparison p-value = 0.24). This result demonstrates that the diversity of DGF profiles from 41 cell types within ENCODE can be generalized to capture transcriptional regulation by most TFs across most cell types.
| Figure 2. Validation of genome-wide TF to target gene database using ChIP-seq gold standard from ENCODE. Filtering predicted transcription factor binding sites through DNAse I hypersensitivity footprints significantly increases sensitivity and specificity for predicting TF from ENCODE ChIP-seq studies. Each line is a ROC curve for comparison to the corresponding the ENCODE ChIP-seq studies. AUC = area under the curve. |
 |
|